
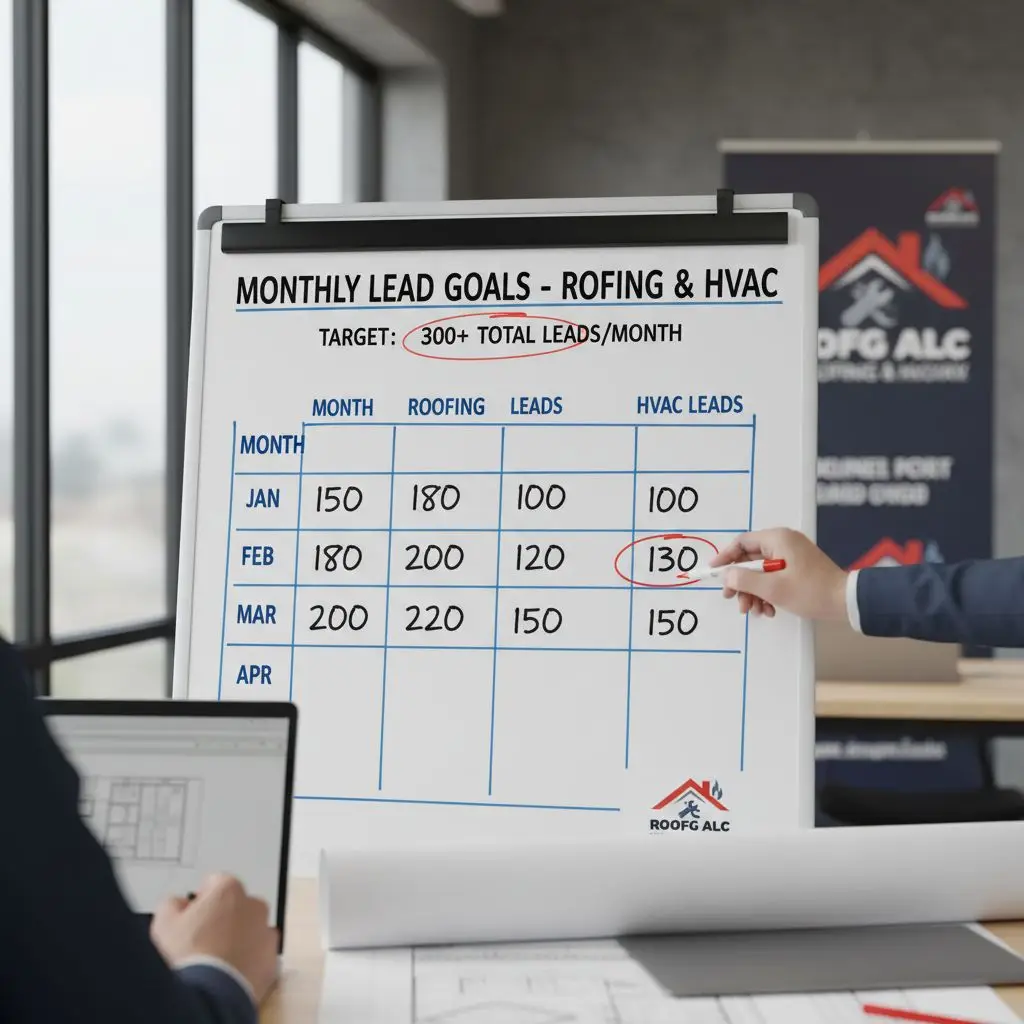
How Many Leads Should a Roofer/HVAC Company Get Per Month?
Use this formula to calculate your real lead target based on your close rate, crew size, and revenue goal.
“How many leads should I be getting?” is one of the most common questions roofing and HVAC owners ask. It’s also the wrong question to lead with.
Lead volume alone tells you nothing about whether your business is healthy.
A company generating 200 leads a month and closing 12% is in worse shape than one generating 60 leads and closing 35%.
Grab a Complimentry Growth Plan for Your Business.
Hit the Blue Button and see what’s possible….
That said, you still need a number to plan around. A way to know if your lead flow is normal, too low, or a sign that budget is being wasted. Below is a realistic benchmark for both trades, plus the formula to calculate the right number for your business.
The Formula: Work Backward From Revenue
Decide the number of jobs you need. Then work backward through your close rate to find your lead target.
Leads Needed = Jobs Needed ÷ Close Rate
Roofing example: 15 signed jobs needed ÷ 30% close rate = ~50 qualified leads/month.
HVAC example: 25 booked jobs needed ÷ 40% close rate = ~63 leads/month.
Comparing your lead count to a competitor’s without knowing their close rate is meaningless. The lead number hides the variable that actually drives revenue.
Realistic Benchmarks by Company Size
| Company Size | Leads/Month | Close Rate | Jobs Booked |
|---|---|---|---|
| Solo / 1 truck | 15 – 30 | 25 – 35% | 4 – 10 |
| Small team (2–4 trucks) | 40 – 80 | 25 – 35% | 10 – 28 |
| Established (5–10 trucks) | 100 – 200 | 25 – 40% | 25 – 80 |
| Multi-crew / regional | 250+ | 25 – 40% | 60+ |
These ranges assume a healthy mix of channels: Google Business Profile, Local Services Ads, paid search, and referrals. A company relying on one channel alone will usually sit at the low end of its bracket.
HVAC-Specific Benchmarks
- A fully optimized, well-reviewed Google Business Profile can generate roughly 20–50 leads/month on its own for an established HVAC contractor.
- Website visitor-to-lead conversion averages around 7.8%. Phone calls convert close to 46%, which is why fast phone response matters more than squeezing extra form fills.
- Blended cost per lead across channels averages around $150. Local Services Ads often land in the $25–$75 range and produce the strongest close rates of any paid channel.
- Booking rate (leads that become a scheduled appointment) sits around 40% industry-wide. More than half of all leads are lost before they become a booked job.
Roofing-Specific Benchmarks
- A roofing company spending $2,000–$3,000/month on non-branded Google Ads can expect 16–24 leads at current cost-per-lead levels.
- Close rates vary sharply by lead type: insurance-restoration 50–70% (claim already validated), retail replacement 20–35% (homeowners comparison shopping), repair 60–80% (urgency).
- A strong overall close rate for residential roofing sits at 30–40%. 50% is excellent. Anything consistently above that may signal underpricing, not superior sales ability.
- Storm events can spike lead volume 5–10x within 48 hours. Roofers with a surge process in place capture dramatically more revenue than those without one.
How to Tell If Your Lead Volume Is Actually a Problem
A low number on paper isn’t automatically bad. A high number isn’t automatically good. Use these signals instead:
- Close rate sits well below the benchmark for your lead type. Under 20% on inbound leads usually points to a sales process or lead-quality issue.
- Your booked-job cost is climbing. A channel with a low sticker price and a low close rate often costs more per actual customer than a pricier, higher-converting channel.
- Crews have open capacity that leads aren’t filling. This is the clearest sign you genuinely need more volume.
- You don’t know your close rate by channel. If that’s the case, tracking has to come before benchmarking does.
The Bottom Line
For single-truck to small-team operators, 15–80 qualified leads a month is normal. For established, multi-crew operations, 100+ is typical.
The number that should drive your decisions: booked jobs per month relative to the capacity you’re trying to fill.
If you don’t know your close rate, your cost per booked job by channel, or how many jobs your crews can absorb, close that gap first. A growth plan built around your specific capacity and close rate will tell you far more than any industry average.
Related posts:
 Why Isn’t My Business Showing Up on Google Maps? 7 Reasons You’re Invisible to Local Customers
 How to Attract High-Value LinkedIn Clients Without Sounding Salesy
 What Should Website Changes Do? Outcome-Based Promises Replace Service Lists
 How to Differentiate: Proprietary Method Creation & Competitive Moats
 Top 10 Methods to Get Qualified Leads: SEO, Email ROI & Referral Trust
 Top 50 Home Service Trades Paid Lead Costs and Average Project Income
 What’s the Easiest Way to Engage Website Visitors & Capture Leads?
 Get Your Business Cited in AI Search Results (And Watch Traffic Follow)
 How to Choose a Personal Injury Lawyer Online: Reviews, Experience, and Factors
 Call Tracking: Turning Marketing Spend into Predictable Revenue